The financial landscape of 2026 has been defined by a singular, overarching theme: geopolitical volatility. As we move through late March, the “safe-haven” trade hasn’t just been a defensive maneuver; it has become the primary driver of alpha for professional traders and retail investors alike. Gold has shattered psychological barriers that stood for decades, while West Texas Intermediate (WTI) Crude Oil has decoupled from traditional economic cycles to follow the drumbeat of conflict.
For those navigating these waters, the data isn’t just a collection of numbers—it’s a warning and an opportunity. Whether you are a Master Trader looking to scale your Assets Under Management (AUM) by proving your mettle in crisis, or an investor trying to protect capital, understanding the wti-oil-gold-market-analysis-2026 is essential. We are currently witnessing a market where historical correlations are breaking, and “black swan” events are becoming the monthly baseline.
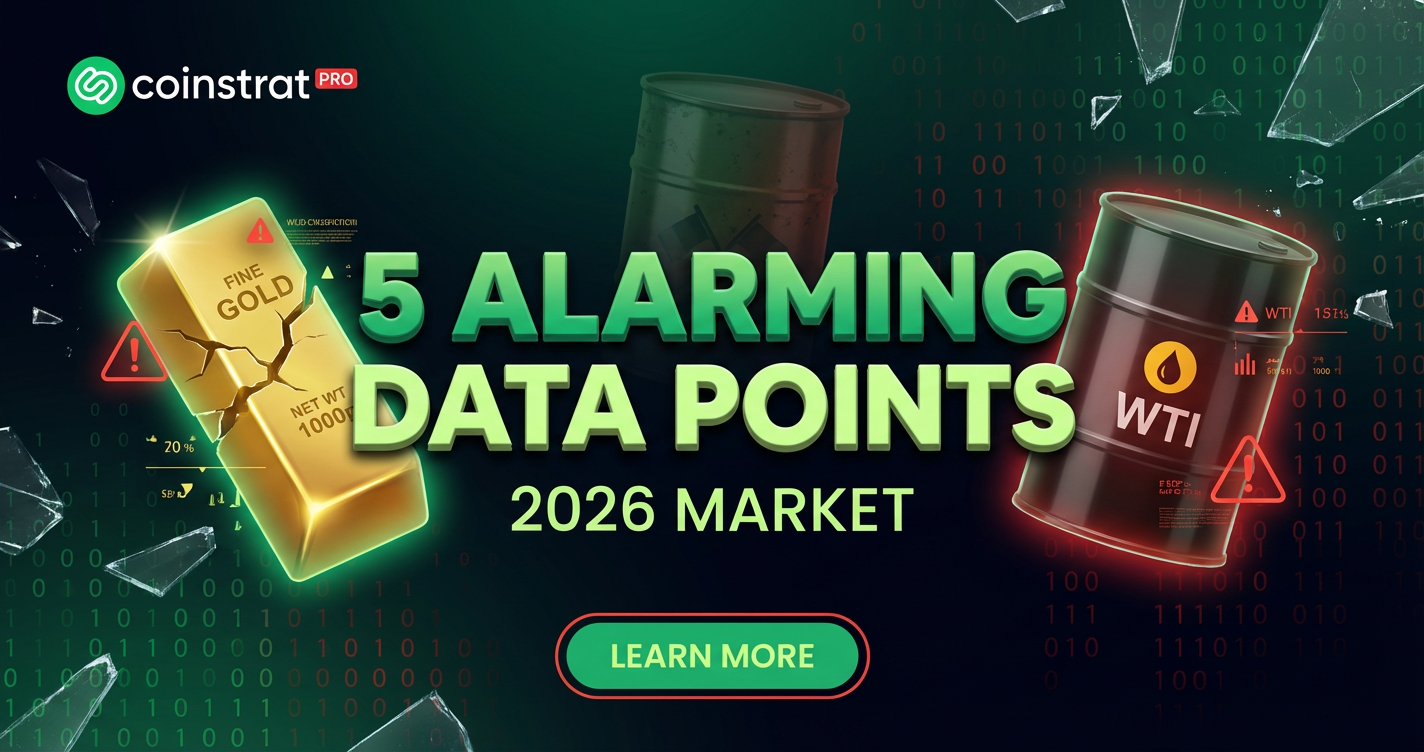
5 Critical Milestones in the 2026 Gold and Oil Surge
In March 2026, Gold (XAU/USD) reached a historic peak near $5,400 per ounce, while WTI Crude Oil spiked over $96.07. These movements represent a 10% gapping open in oil and a sustained bullish channel in gold, driven by unprecedented safe-haven demand and Middle Eastern supply chain threats. According to market data from March 20, 2026, the following milestones have redefined the commodity sector:

- Gold’s Ascent Toward $5,600: After trading at $2,000 in early 2024, Gold hit a peak of over $5,500 in January 2026. Despite a brief sell-off sparked by the Iran War reaching $4,660, the long-term structural supports—primarily central bank demand at 60-year highs—remain intact.
- WTI Breaking the $70 Resistance: For 30 months, $70 was a ceiling for WTI. On March 2, 2026, it didn’t just break this level; it gapped 11% higher, opening at levels that threatened to ignite global inflation.
- The Strait of Hormuz Risk: Market participants are pricing in a “haven first” reaction due to fears of a total closure of the Strait of Hormuz, which traditionally handles 20% of global oil consumption.
- De-dollarization Acceleration: The shift away from the USD as the sole reserve currency has forced institutional players to increase gold allocations, creating a “floor” for prices that few analysts predicted two years ago.
- The $96.07 Oil Baseline: Recent analysis from Capital Street FX notes that WTI touched $96.07 in mid-March, a level that has shifted from a “spike high” to a potential new baseline as geopolitical tensions extend.
For traders, this environment demands more than just a standard strategy; it requires institutional-grade execution. Using the Coinstrat Pro cTrader terminal allows Master Traders to execute trades in milliseconds, ensuring that when gold gaps $50 in a single minute, their slippage is minimized and their entry is precise. This is particularly vital when managing high-stakes copytrading pools where precision is the difference between profit and liquidation.
Technical Indicators Confirming the Bullish Commodity Breakout
Technical analysis shows gold oscillating in a minor ascending channel supported at $5,238, while WTI Crude has transitioned from ‘consolidation-volatile’ to ‘volatile’ status. Key indicators like the +DI being well over -DI and RSIs in overbought territory confirm a strong trending market for both assets. When learning how-to-trade-gold-xauusd-during-volatility, the following indicators have proven most reliable in the current 2026 climate:

| Indicator | Gold (XAU/USD) Status | WTI Crude Status | Actionable Insight |
|---|---|---|---|
| RSI (14) | Overbought (>70) | Overbought (>70) | Expect pullbacks but do not short against the trend. |
| DMI (-DI/+DI) | +DI well above -DI | +DI well above -DI | Strong bullish trend; momentum heavily favors longs. |
| ADX | Trending > 25 | Trending > 30 | High trend strength; avoid range-bound strategies. |
| Pivot Levels | Support at $5,238 | Pivot at $67.80 | Critical floors for maintaining the bullish thesis. |
The Relative Strength Index (RSI) and Average Directional Movement Index (ADX) currently signal that while assets are overbought, the momentum is so strong that standard mean-reversion strategies—like selling because the price “is too high”—are failing. Master Traders on Coinstrat Pro often utilize the 6 flexible allocation methods to manage this volatility, allowing them to reverse or pause copies for their followers if the RSI indicates an imminent “blow-off top.” This level of granular risk management is essential to prevent emotional trading from leading to catastrophic drawdowns during these violent price swings.
Furthermore, the Bollinger Band expansion we are seeing in WTI oil suggests that the market is entering a phase of extreme volatility. When the bands widen significantly, price action often “walks the band,” staying in the overbought zone for much longer than traditional oscillators might suggest. Traders must be wary of overtrading in these zones, as the high-frequency movements can lead to death by a thousand stops.
How Extreme Buy Sentiment is Shaping Market Liquidity
Current market sentiment for WTI Crude has moved into ‘extreme buy’ territory (71-74% long), as reported by recent Commitment of Traders (CoT) data. This heavy retail and speculator positioning creates a high-liquidity environment but increases the risk of sharp corrective pullbacks if geopolitical tensions ease. In the wti-oil-gold-market-analysis-2026, “liquidity clusters” are forming near major resistance zones, which can act as a magnet for price discovery.

Retail investors often suffer from a fear mindset, either entering too late because they feel they’ve missed the move or exiting too early out of panic. However, at Coinstrat Pro, the social copytrade ecosystem allows retail investors to step back and let professionals handle the execution. For Master Traders, this surge in sentiment and liquidity is a double-edged sword: deep liquidity ensures tight spreads (often as low as 0.0 pips on Raw accounts), but the “crowded trade” risk means a single piece of news (such as the rumored US-Iran deal) could cause a violent $5–$10 gap down in minutes.
“We are in a headline-driven market where updates can easily cause movements as markets try to price in the latest news and traders tussle over where they see things headed.” — Monte Safieddine, Market Analyst.
The professional strategy during this period isn’t necessarily about predicting the next peak, but about managing the Risk-Off Gaps. When gold gapped higher to $5,400 earlier this month, many traders found their stop-losses bypassed. This is why institutional-grade liquidity filters are vital. Coinstrat Pro provides access to deep tier-1 liquidity, ensuring that even in “volatile-consolidation” phases, trade execution remains robust across its 1,200+ instruments.
Market Sentiments and Position Weighting
- Heavy Retail Longs: Retail sentiment is currently at an 18-month high for commodities. Historically, extreme retail positioning can signal a local top is nearing.
- Institutional Hedging: Large speculators have upped their net long sentiment to 74%. This indicates that “smart money” is not yet ready to bet on a de-escalation.
- Safe-Haven Dominance: The flight to gold is no longer just about inflation; it is about capital preservation in the face of a shifting world order (de-dollarization).
Maximizing the Opportunity as an IB or Master Trader
The current market conditions of 2026 represent a goldmine for Introducing Brokers (IBs) and professional managers. With volatility comes volume, and with volume comes commission potential. The Coinstrat Pro “Unlimited Level” IB program is uniquely positioned for this environment. As investors flock to gold and oil to escape stock market corrections, IBs can earn from a multi-level structure that captures every pip of this immense volatility.

For Master Traders, there has never been a better time to prove technical superiority. By mastering how-to-trade-gold-xauusd-during-volatility, traders can offer their followers performance that outpaces traditional benchmarks. The ability to choose from six distinct fee structures—including volume-based and performance-based tiers—means that as a Master Trader grows their pool from 100 to 10,000 followers, their monetization scales in real-time with their success.
Strategic Takeaways for Traders
Success in 2026 requires more than just a chart; it requires a platform that doesn’t freeze when the volatility hits peak intensity. Consider these final tactical steps:
- Monitor the $67.80 Pivot for WTI: If oil falls below this level, the 30-month breakout might be invalidated, leading to a massive liquidation of long positions.
- Use the “Reverse Copy” Feature: In high-volatility markets, some traders may want to hedge their own positions by reverse-copying a master trader who has a high-risk profile.
- Leverage the Spot Crypto Wallet: Use your crypto holdings as collateral to trade commodities, bridging the gap between digital assets and traditional safe havens.
The 2026 market isn’t for the faint of heart, but for those with the right tools and a disciplined mindset, it is the most profitable era in recent history. Stop reacting to the market and start positioning within it. Whether through direct execution on cTrader or by joining a community of experts via social copytrading, the wti-oil-gold-market-analysis-2026 suggests the ride is far from over.
Actionable Step: Audit your current risk management settings today. Ensure your equity limits are set and your risk ratio is adjusted to account for the current $100+ daily ranges in Gold. If your broker doesn’t offer instant commission payouts or millisecond execution, consider if your infrastructure is holding back your alpha.
FAQ
What is the historical significance of gold reaching $5,400?
Gold reaching $5,400 in early 2026 marks a 170% increase from its 2024 baseline of $2,000. It represents the successful transition of gold from a mere inflation hedge to a primary global reserve asset, spurred by unprecedented de-dollarization and geopolitical conflict in the Middle East.
How does the DMI indicator help in trend-following gold?
The Directional Movement Index (DMI) is critical in gold trading because it distinguishes between a ranging market and a trending one. In 2026, the +DI (positive indicator) has remained consistently above the -DI (negative indicator), while the ADX line has exceeded 25, confirming that the bullish trend is mechanically strong and not just a temporary spike.
Can I trade gold 24/7 on Coinstrat Pro?
While traditional spot gold markets close briefly over the weekend, Coinstrat Pro’s hybrid infrastructure allows for seamless management of assets. You can manage your funds, move capital between your spot crypto wallet and trading accounts 24/7, and access gold markets during all global session hours (Monday-Friday) with lightning-fast execution.
What is the impact of a ‘gap’ in gold prices on stop-loss orders?
A price gap occurs when the market opens significantly higher or lower than its previous close without any trading in between (common during weekend geopolitical escalations). If gold ‘gaps’ over your stop-loss level, the order will typically be executed at the next available market price, which can result in a larger loss than anticipated—this is why using a broker with deep tier-1 liquidity is essential to minimize slippage.